Case study
LineView: a production spreadsheet, turned into a live dashboard
A sample product build by NextWave Systems. It exists to show, with running code, the kind of reporting and operations tooling I build for clients.
The problem
Small manufacturers run production off spreadsheets. Somebody exports the day's log, somebody else builds the chart, and by the time it reaches the wall in the break room it is a week old and nobody trusts it. The data is fine; the pipeline from the file to a screen is the missing part.
What it does
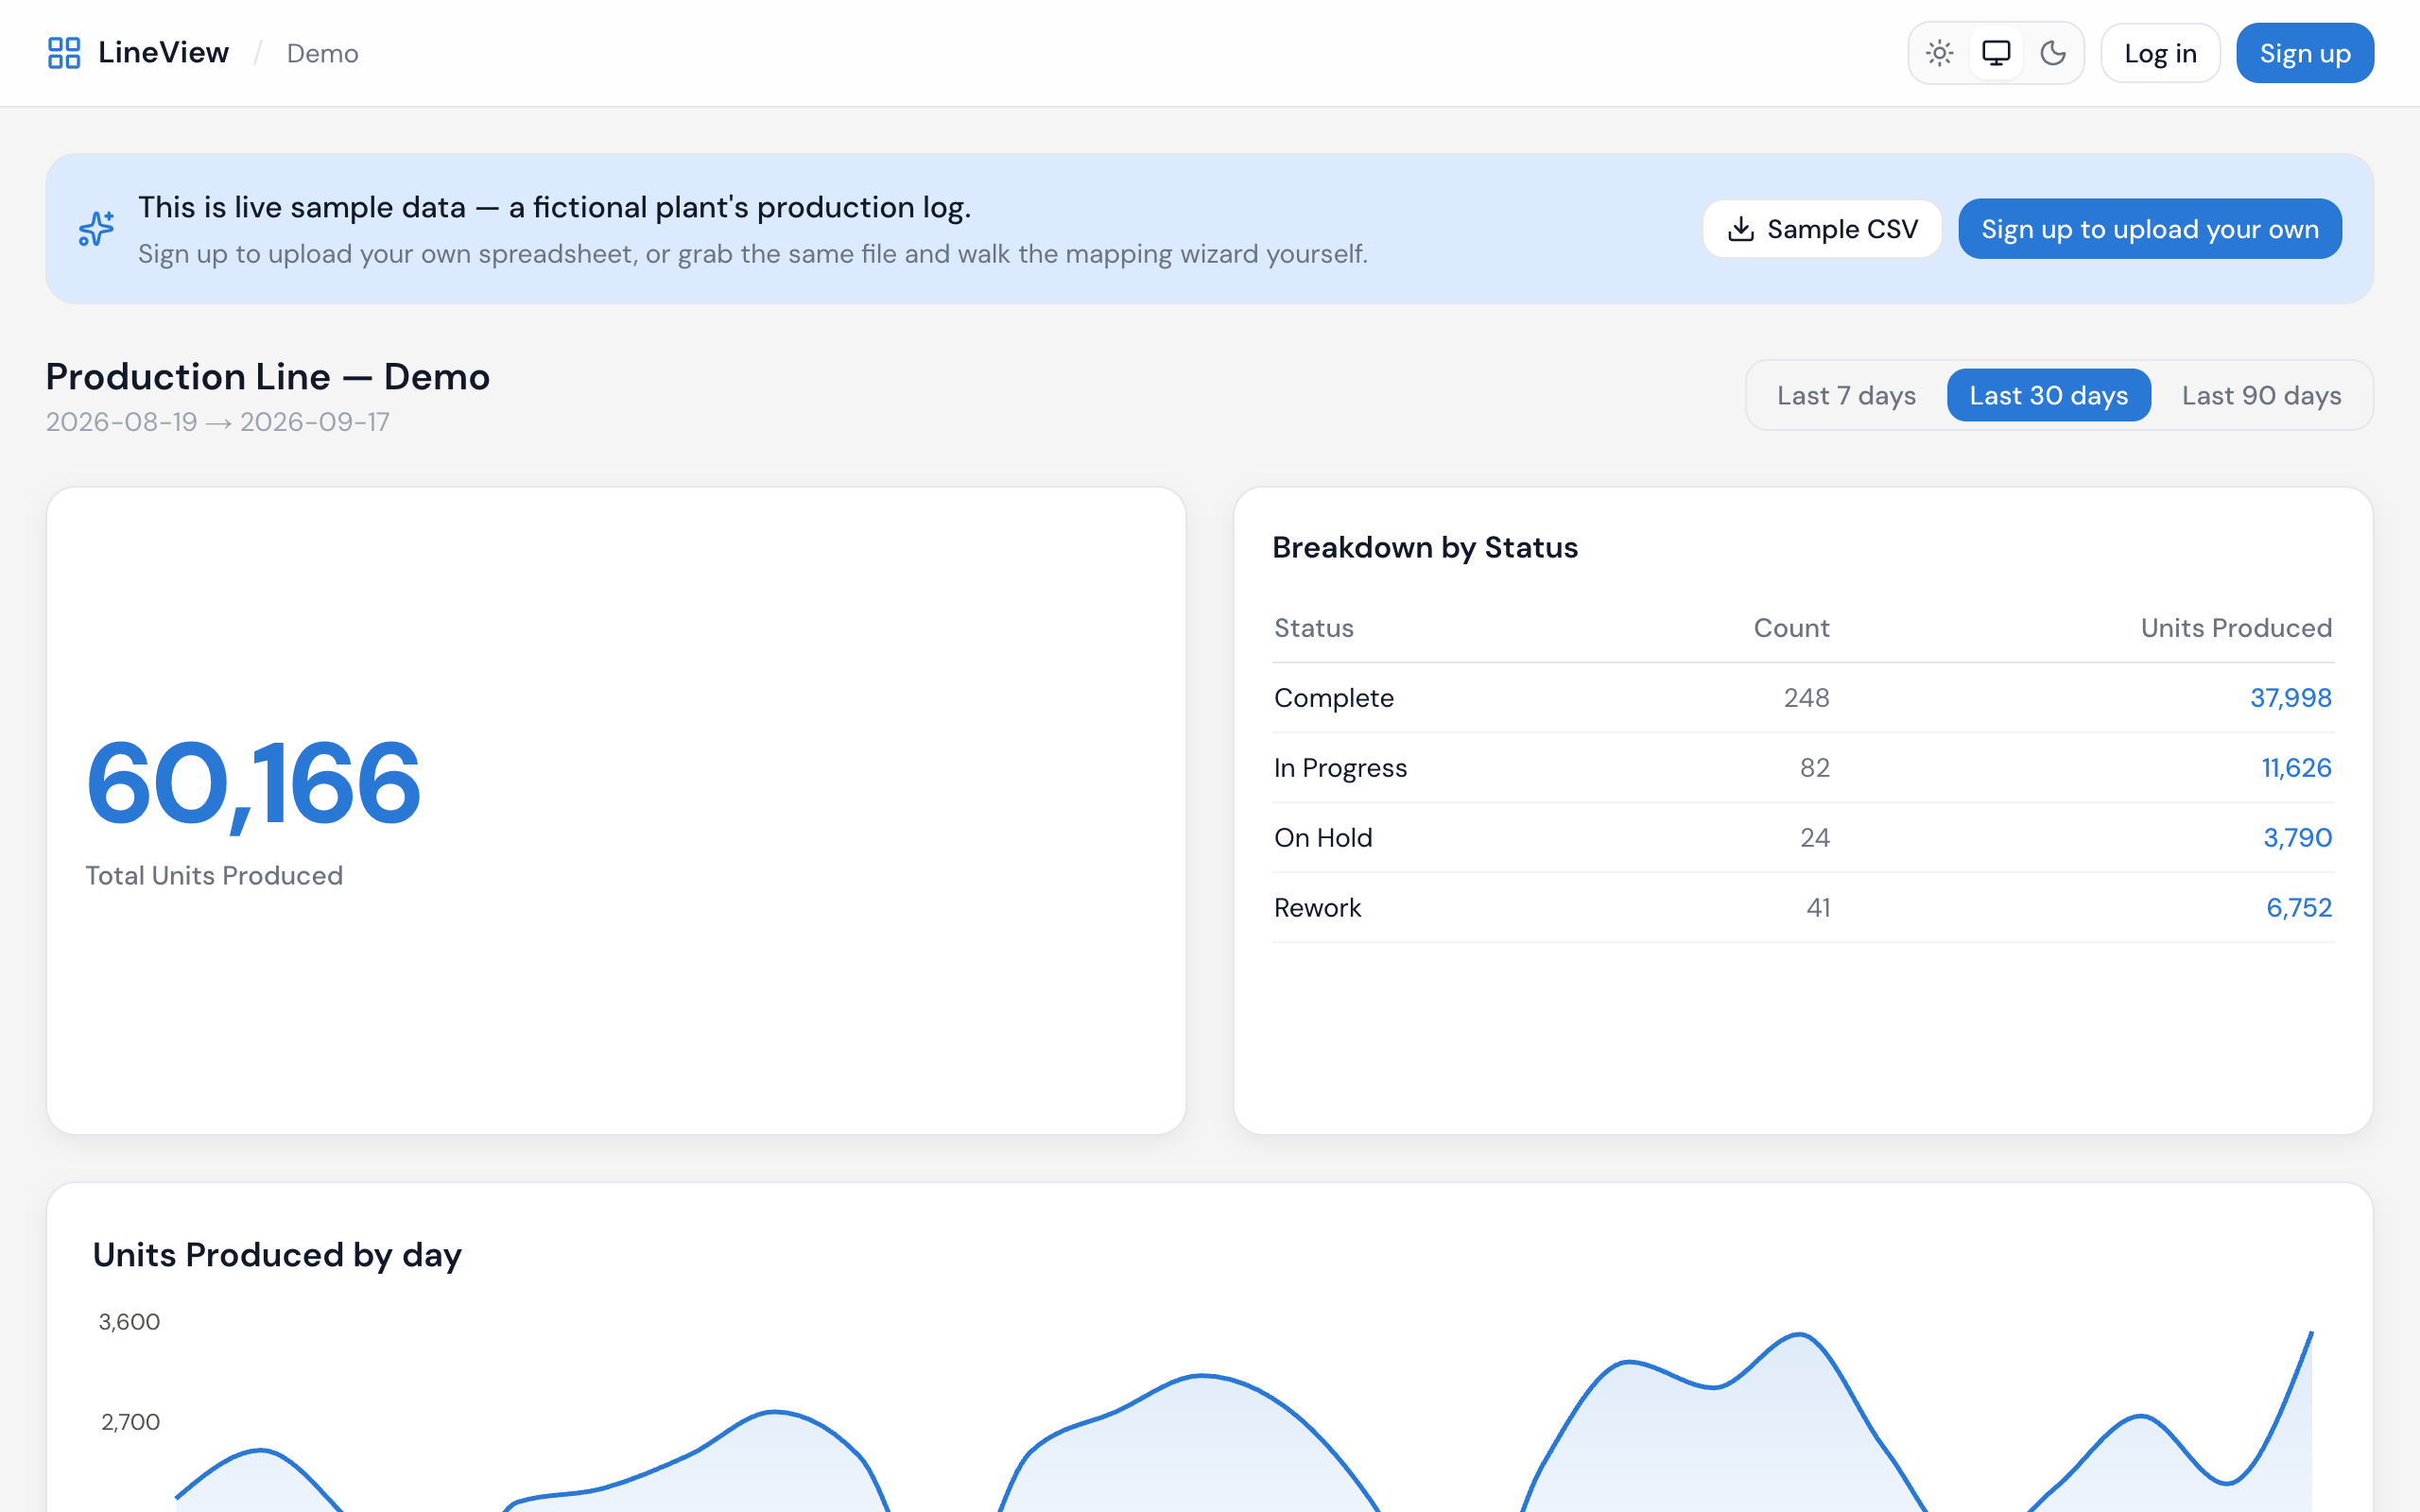
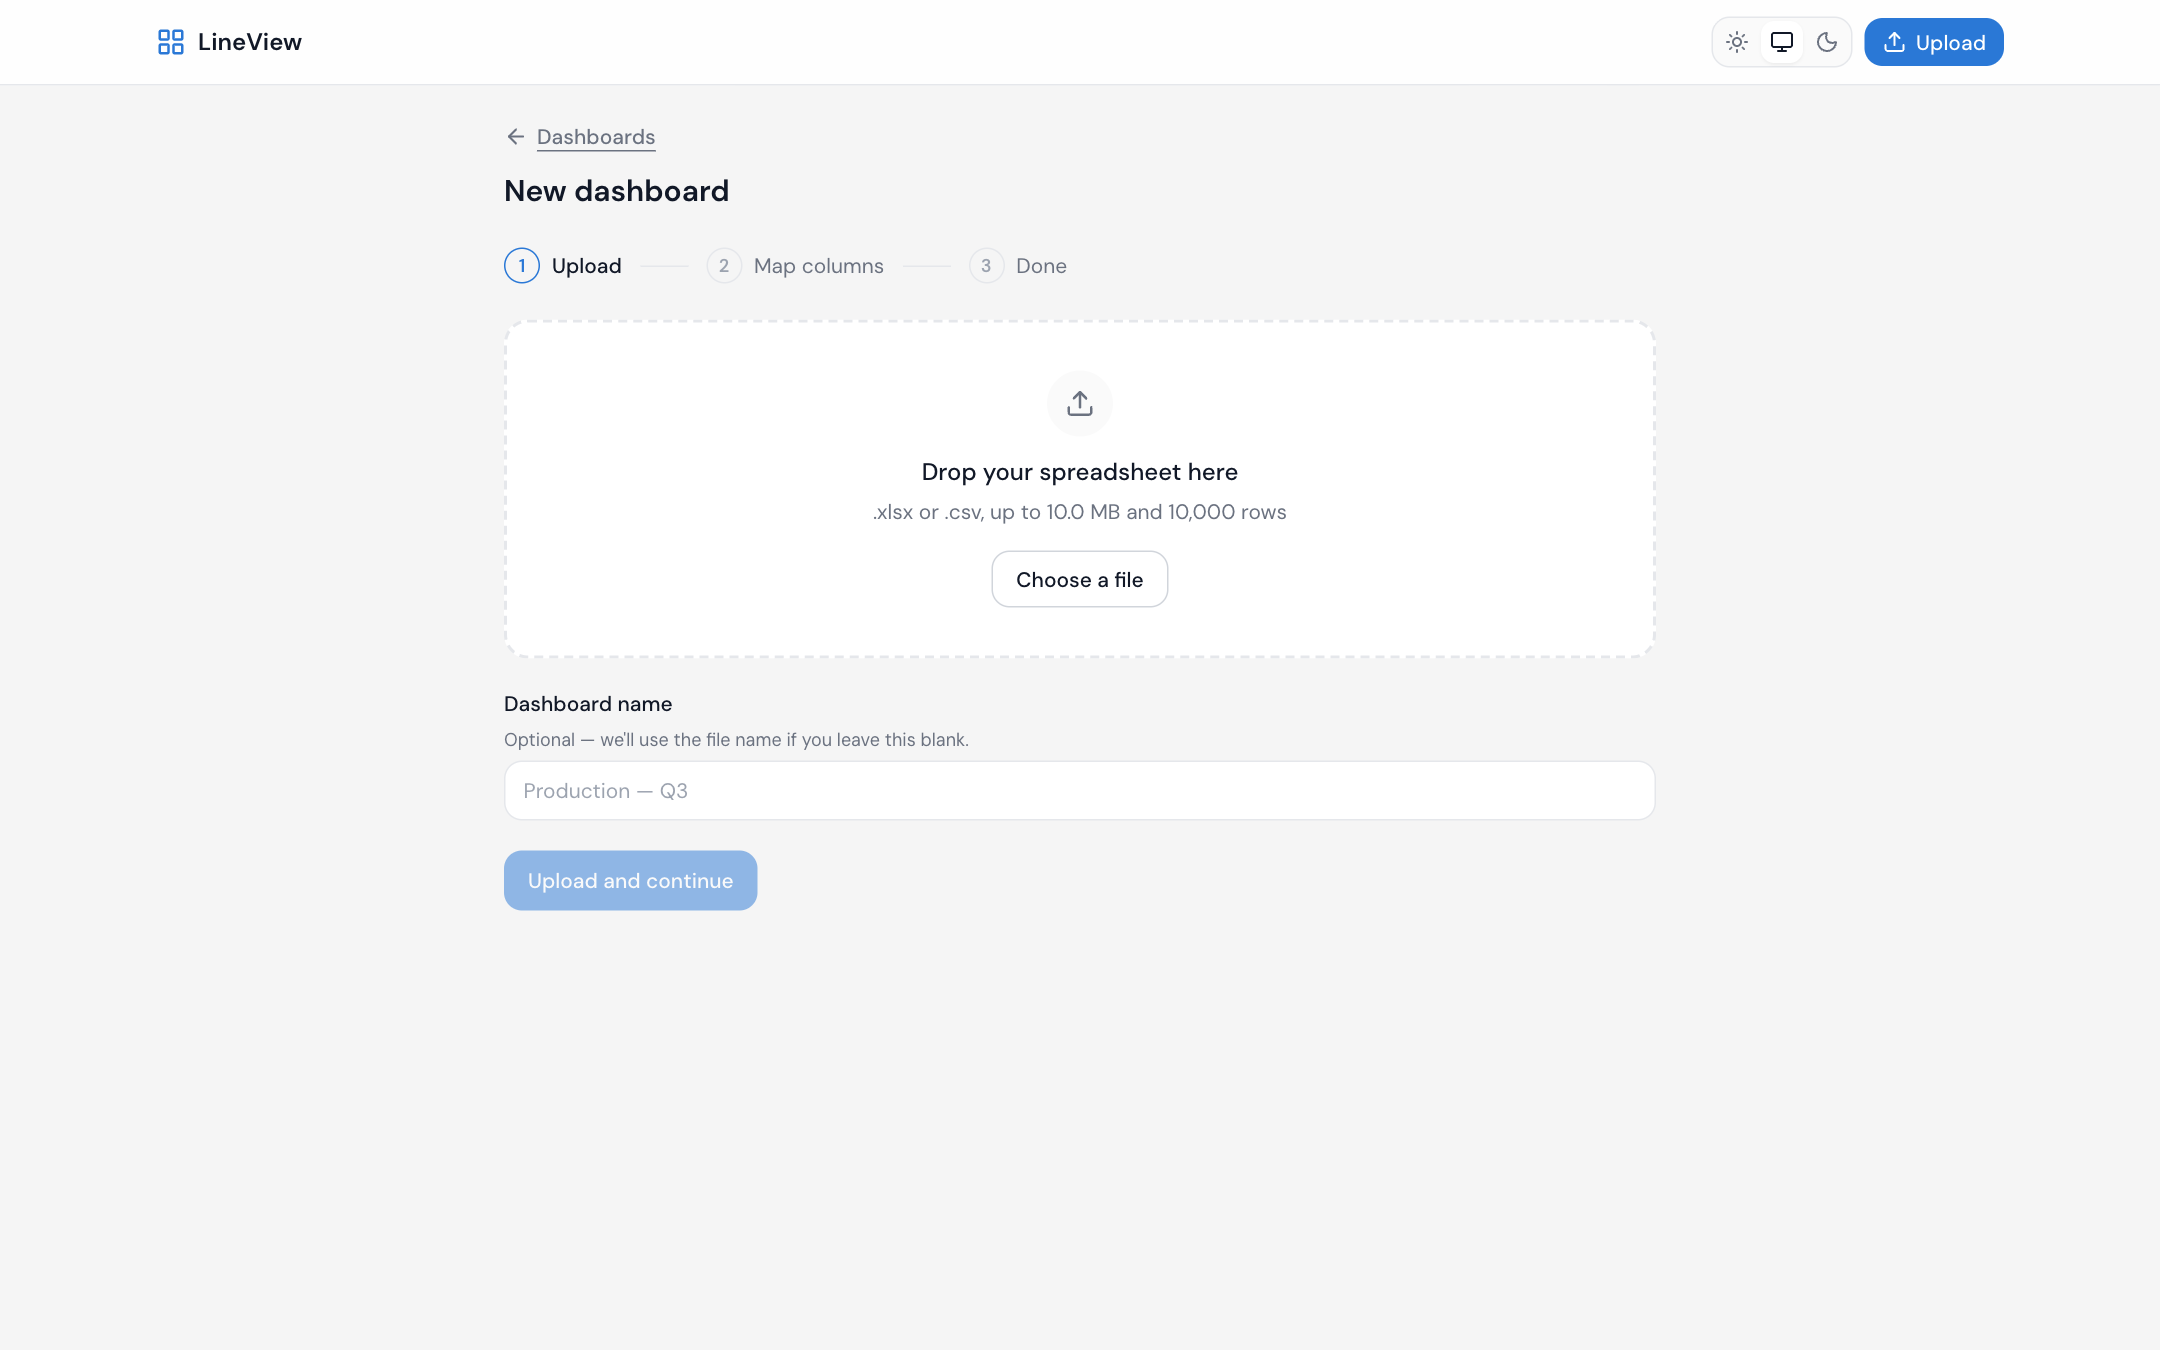
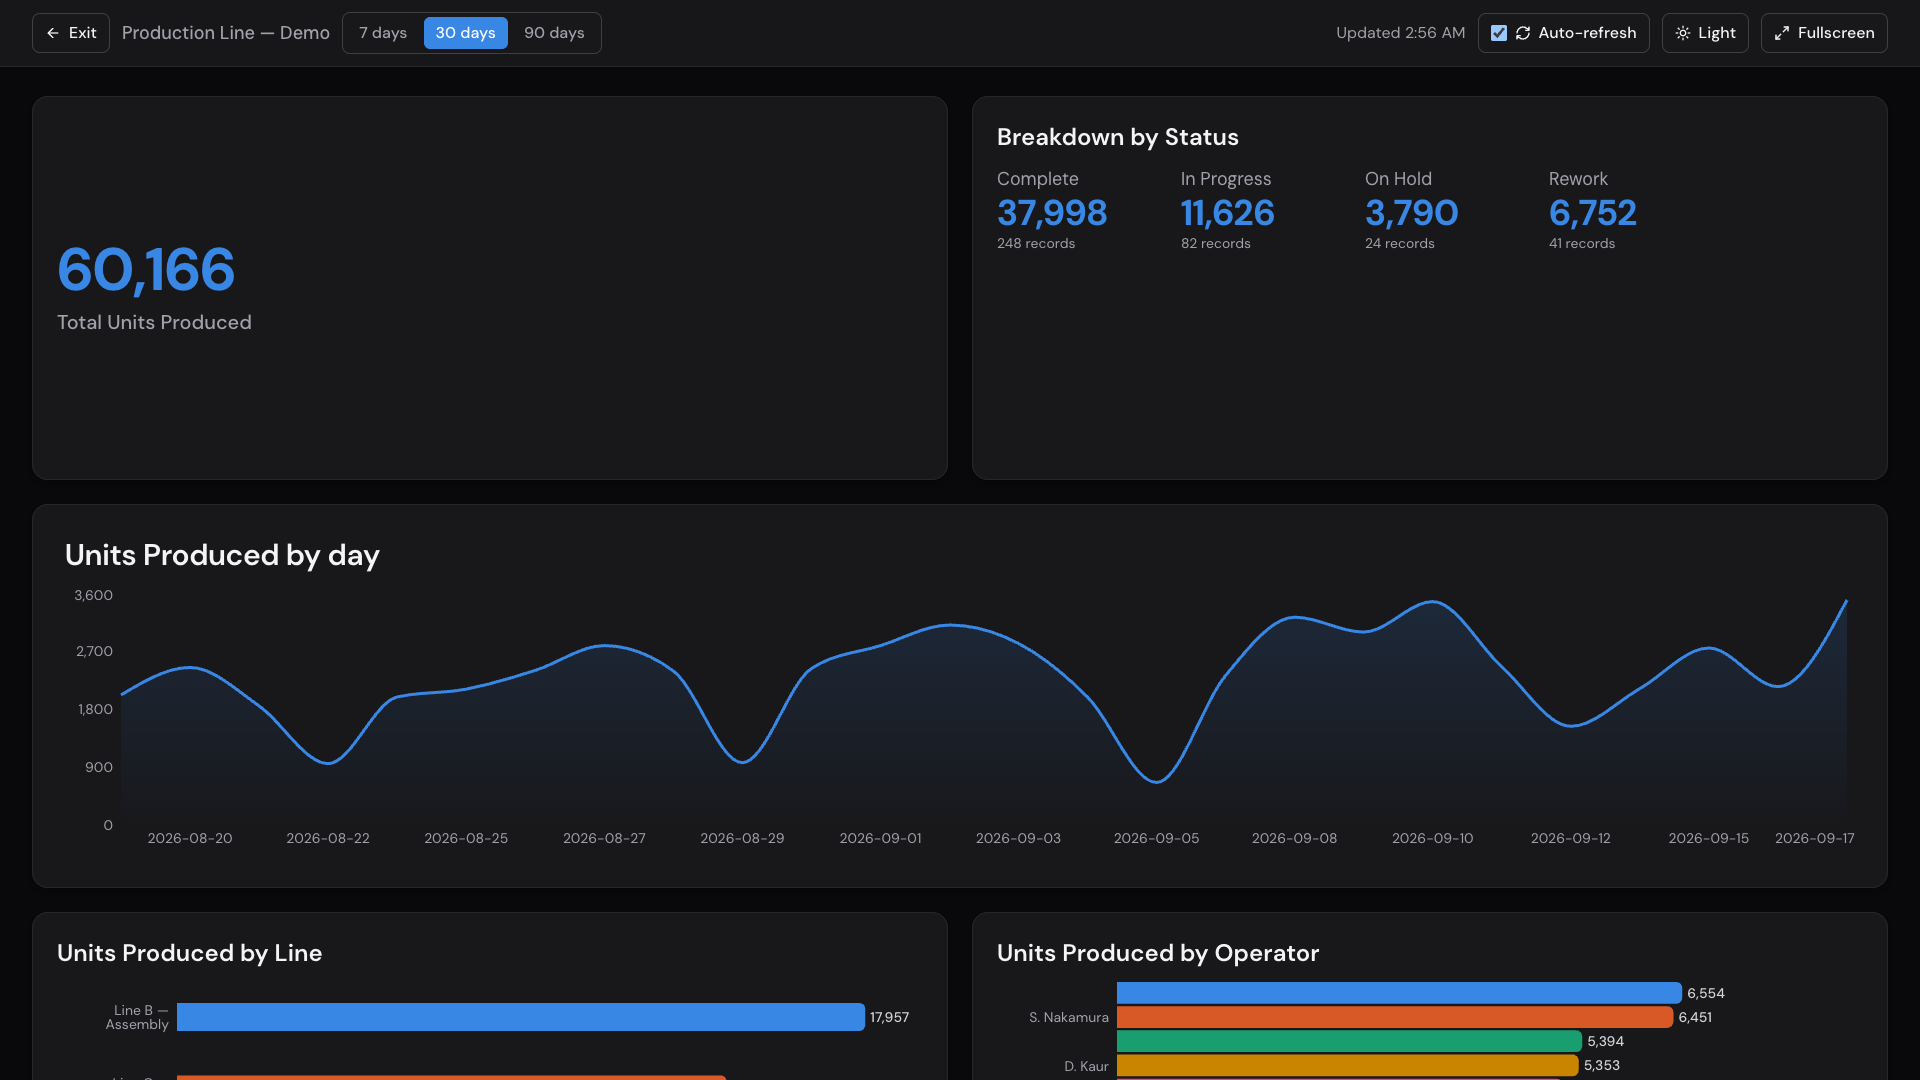
Upload the .xlsx or .csv you already keep. Say once which column is the date, which is the number and which are the categories. LineView normalises the rows, stores them, and serves a dashboard: totals, a daily trend, and breakdowns by any column in the file. Arrange the widgets, rename them, and open the same board full-screen on a TV.
Stack
- Frontend
- Next.js 14 App Router, React 18, TypeScript, Tailwind CSS, Recharts
- Backend
- Supabase: Postgres with row-level security, Auth, Storage, and Deno Edge Functions
- Hosting
- Vercel for the app; Supabase for data, files and functions
- Quality
- Vitest unit tests over the pure logic; typecheck, lint and build gate every commit
Engineering decisions worth your attention
The parts of the build a client should care about, because they are the parts that decide whether a tool like this keeps working after the handoff.
1.Tenant isolation lives in the database, not in every query
Each account is one organisation. A single Postgres function, current_user_org_id(), reads the signed-in user's org and every row-level security policy keys off it. The API routes select from datasets and records without an org filter at all, because the session already decides what the query can see. Forgetting a WHERE clause cannot leak another company's numbers.
2.The public demo runs with the public key
The demo you can open without an account is served with the publishable key, never the service role. One dataset carries an is_public_demo flag, a partial unique index guarantees there is only ever one, and the demo's organisation has no members, so no signed-in account can reach it either. Responses are cached for a minute so public traffic cannot become unbounded aggregate queries.
3.The import refuses to build a dashboard of zeros
Mapping a text column to the number field used to import silently and chart nothing. The wizard now shows sample rows under every choice and blocks a mapping that would produce no numbers. Date detection needs two separate runs of digits, because JavaScript happily reads a part number like NW-6001 as the first of January in the year 6001.
4.Value normalisation is approved once, applied everywhere
Spreadsheets say complete, COMPLETE and Complete for the same thing. The wizard proposes groups for a human to approve; the approved groups are then applied at import and again at read time by one shared module that the Deno functions and the Vitest suite both import through the same path. It used to be three near-copies, and editing one split labels into duplicates in the others.
5.One renderer for every surface
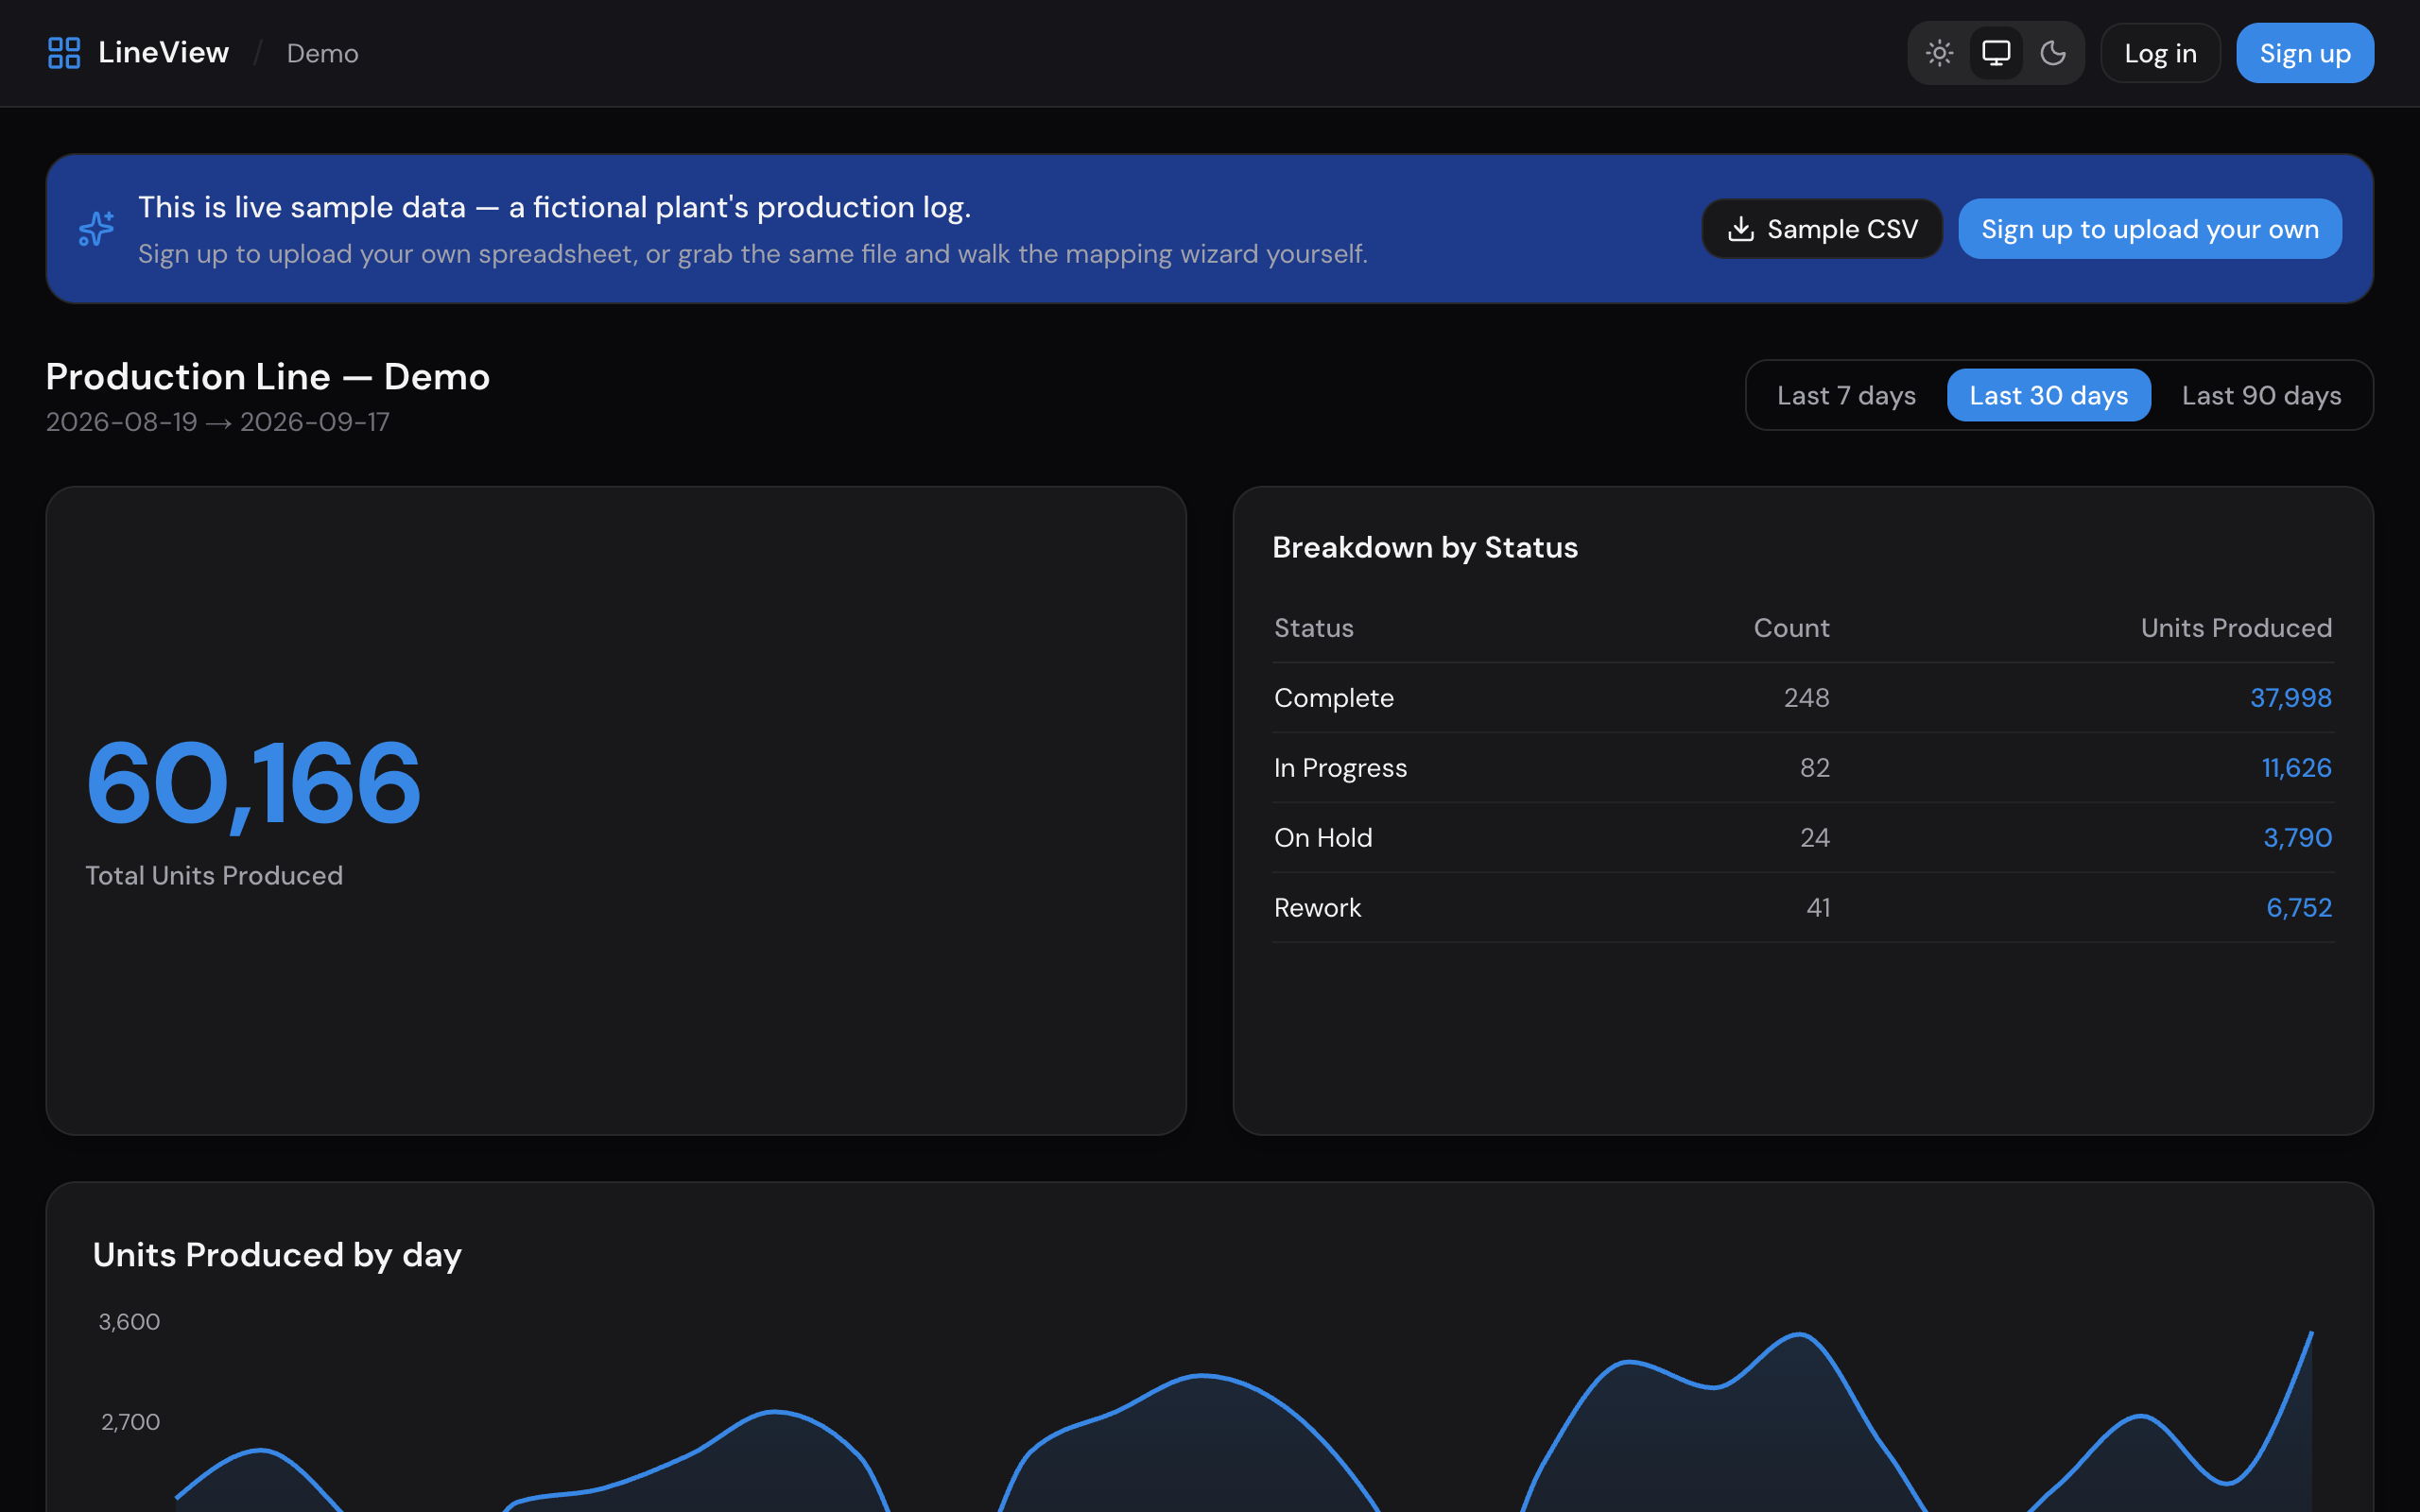
The dashboard, its editor, the public demo and the TV mode all mount the same Widget component. A density prop is the only difference between a laptop card and a wall display. Colour comes from an explicit prop rather than a global theme class, which is what lets a TV run dark while the office runs light.
6.The browser never talks to the backend directly
Every request goes browser → same-origin API route → Edge Function → Postgres RPC, with the user's own token forwarded at each hop so row-level security applies end to end. No CORS, no keys in cross-origin requests, and one place to add a check when a route needs one.
What it deliberately isn't
Billing exists in the code and is switched off; this is a portfolio piece, not a paid product. There is one organisation per account and no invitations. Share links are built in the backend but not switched on until the public page renders the owner's exact layout. Those are scoping decisions, called out rather than hidden.
Try it
The demo needs no account. Grab its sample file and walk the wizard yourself, or talk to me about the spreadsheet your team actually runs on.