For small manufacturing teams
Turn a production spreadsheet into a live KPI dashboard
Upload the Excel file you already keep, map its columns once, and get totals, trends and breakdowns you can put on a screen on the shop floor.
No card required. LineView is free while it's in demo. Read how it's built.
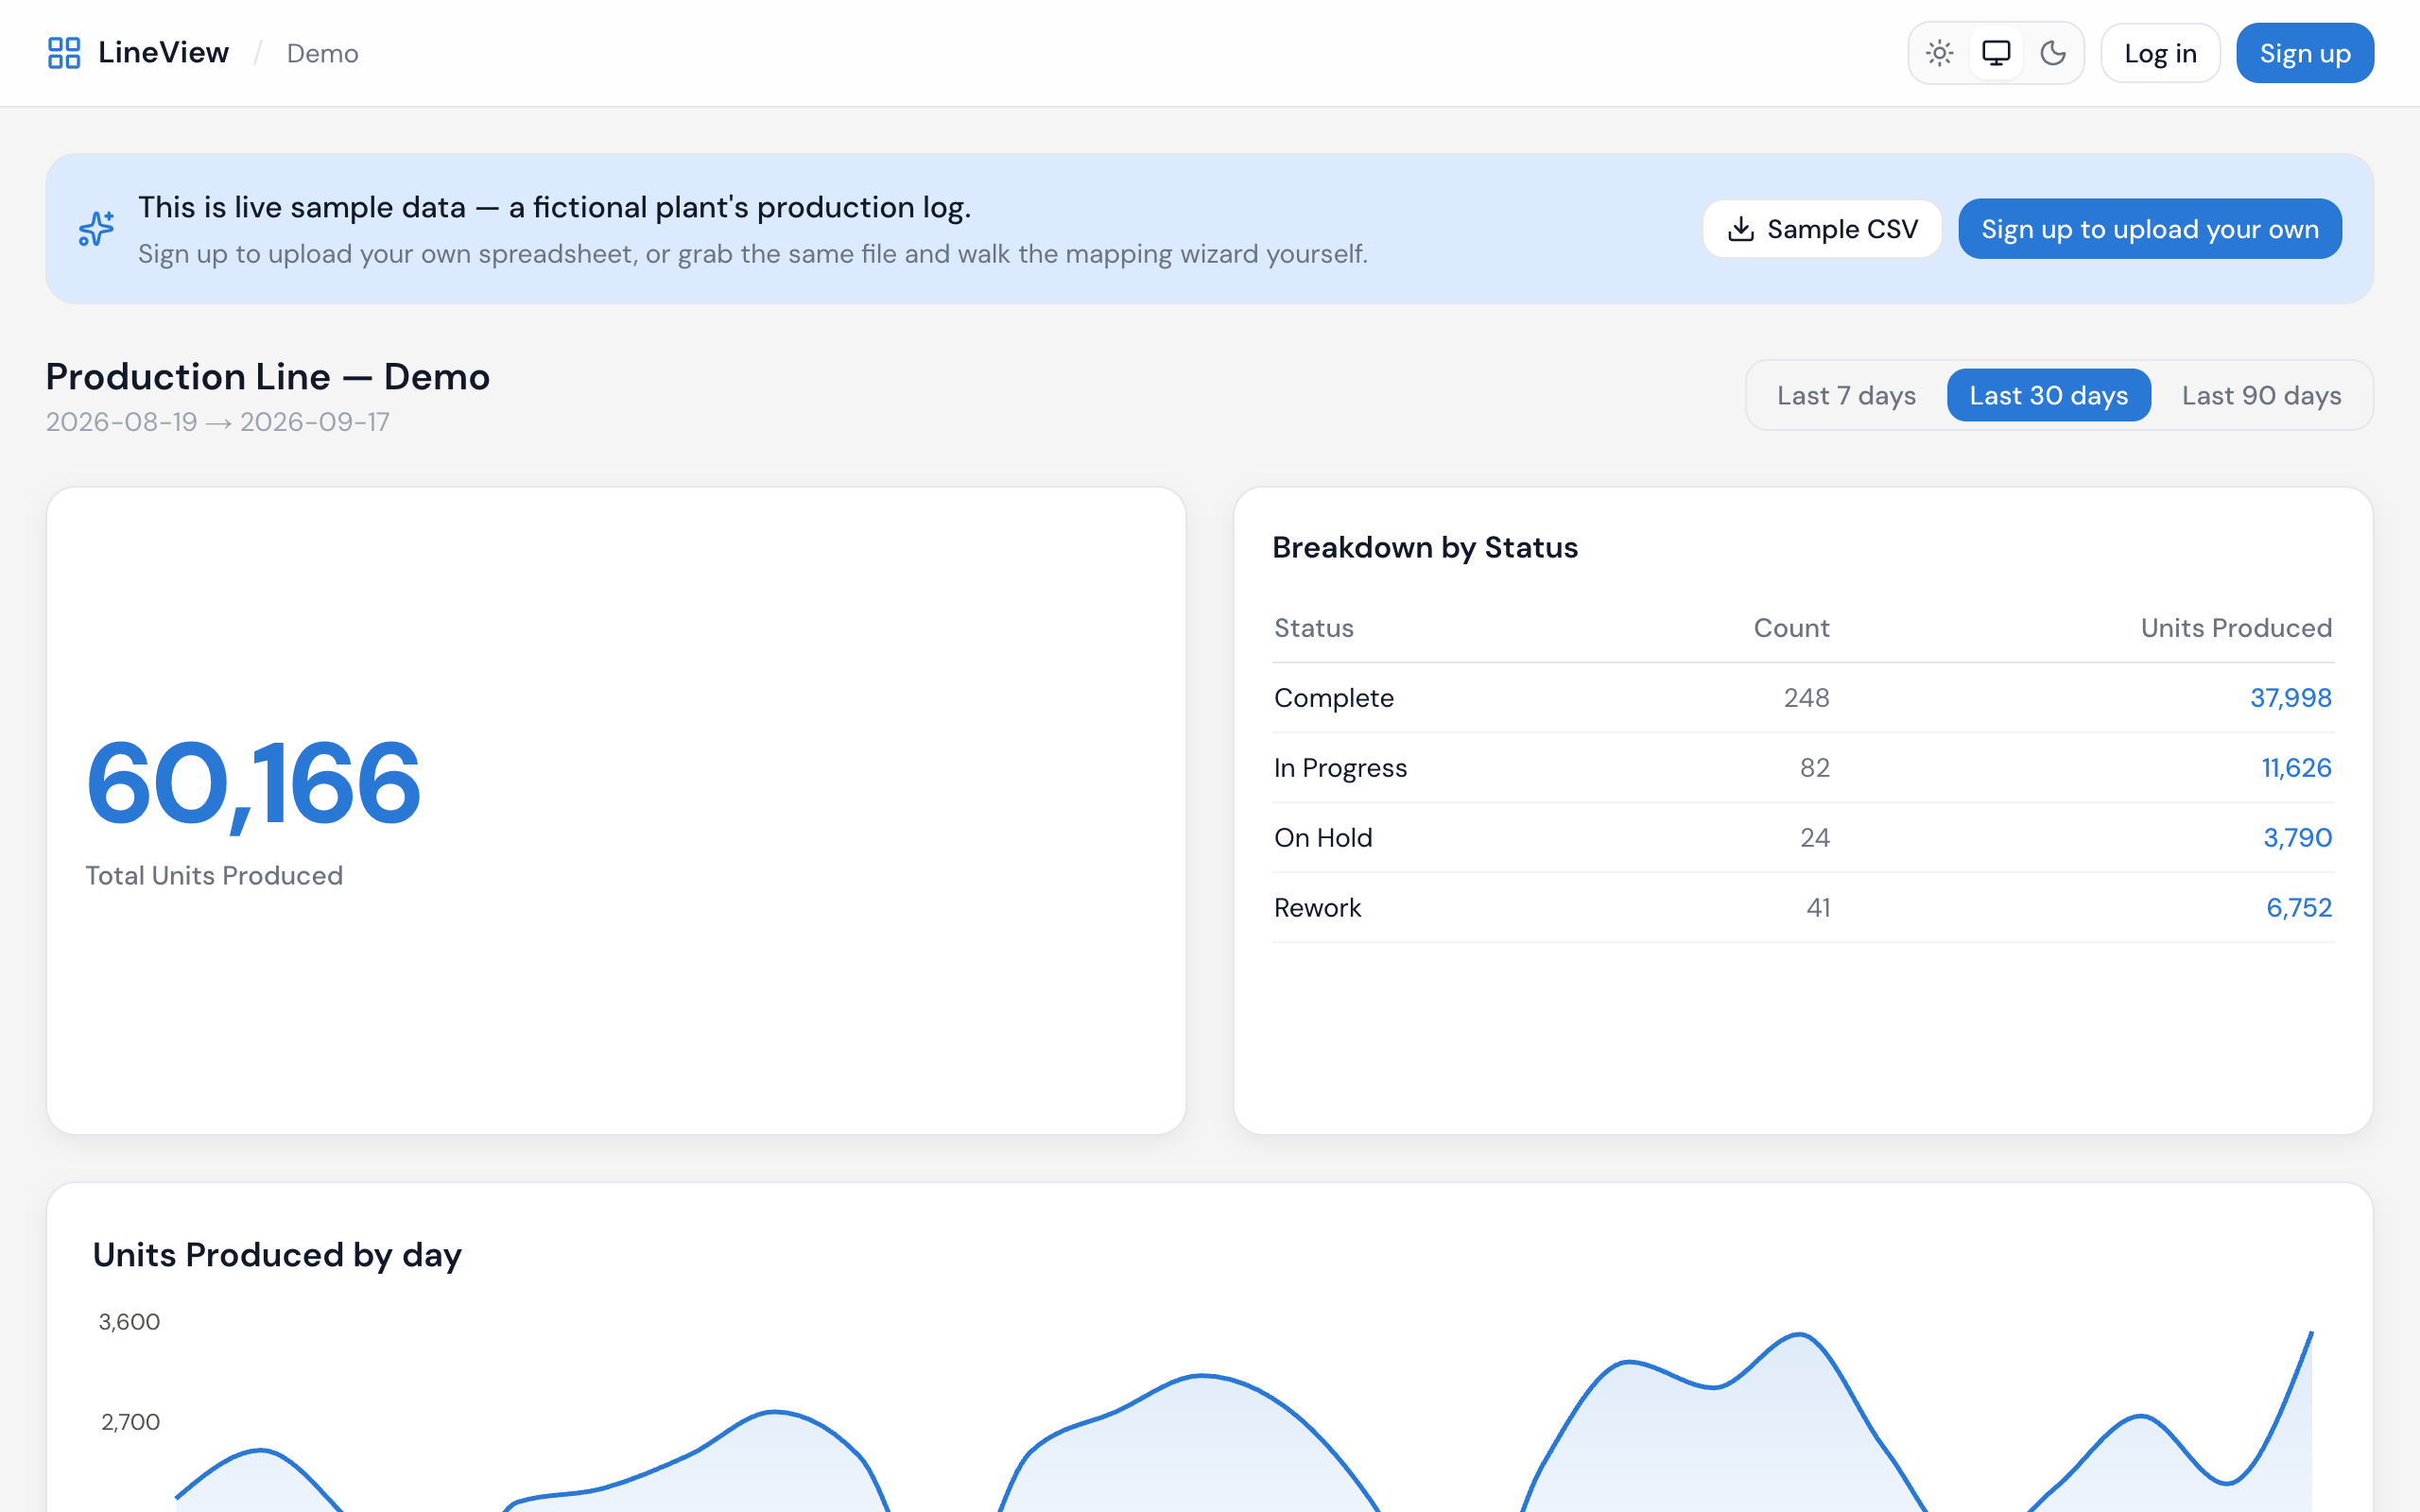
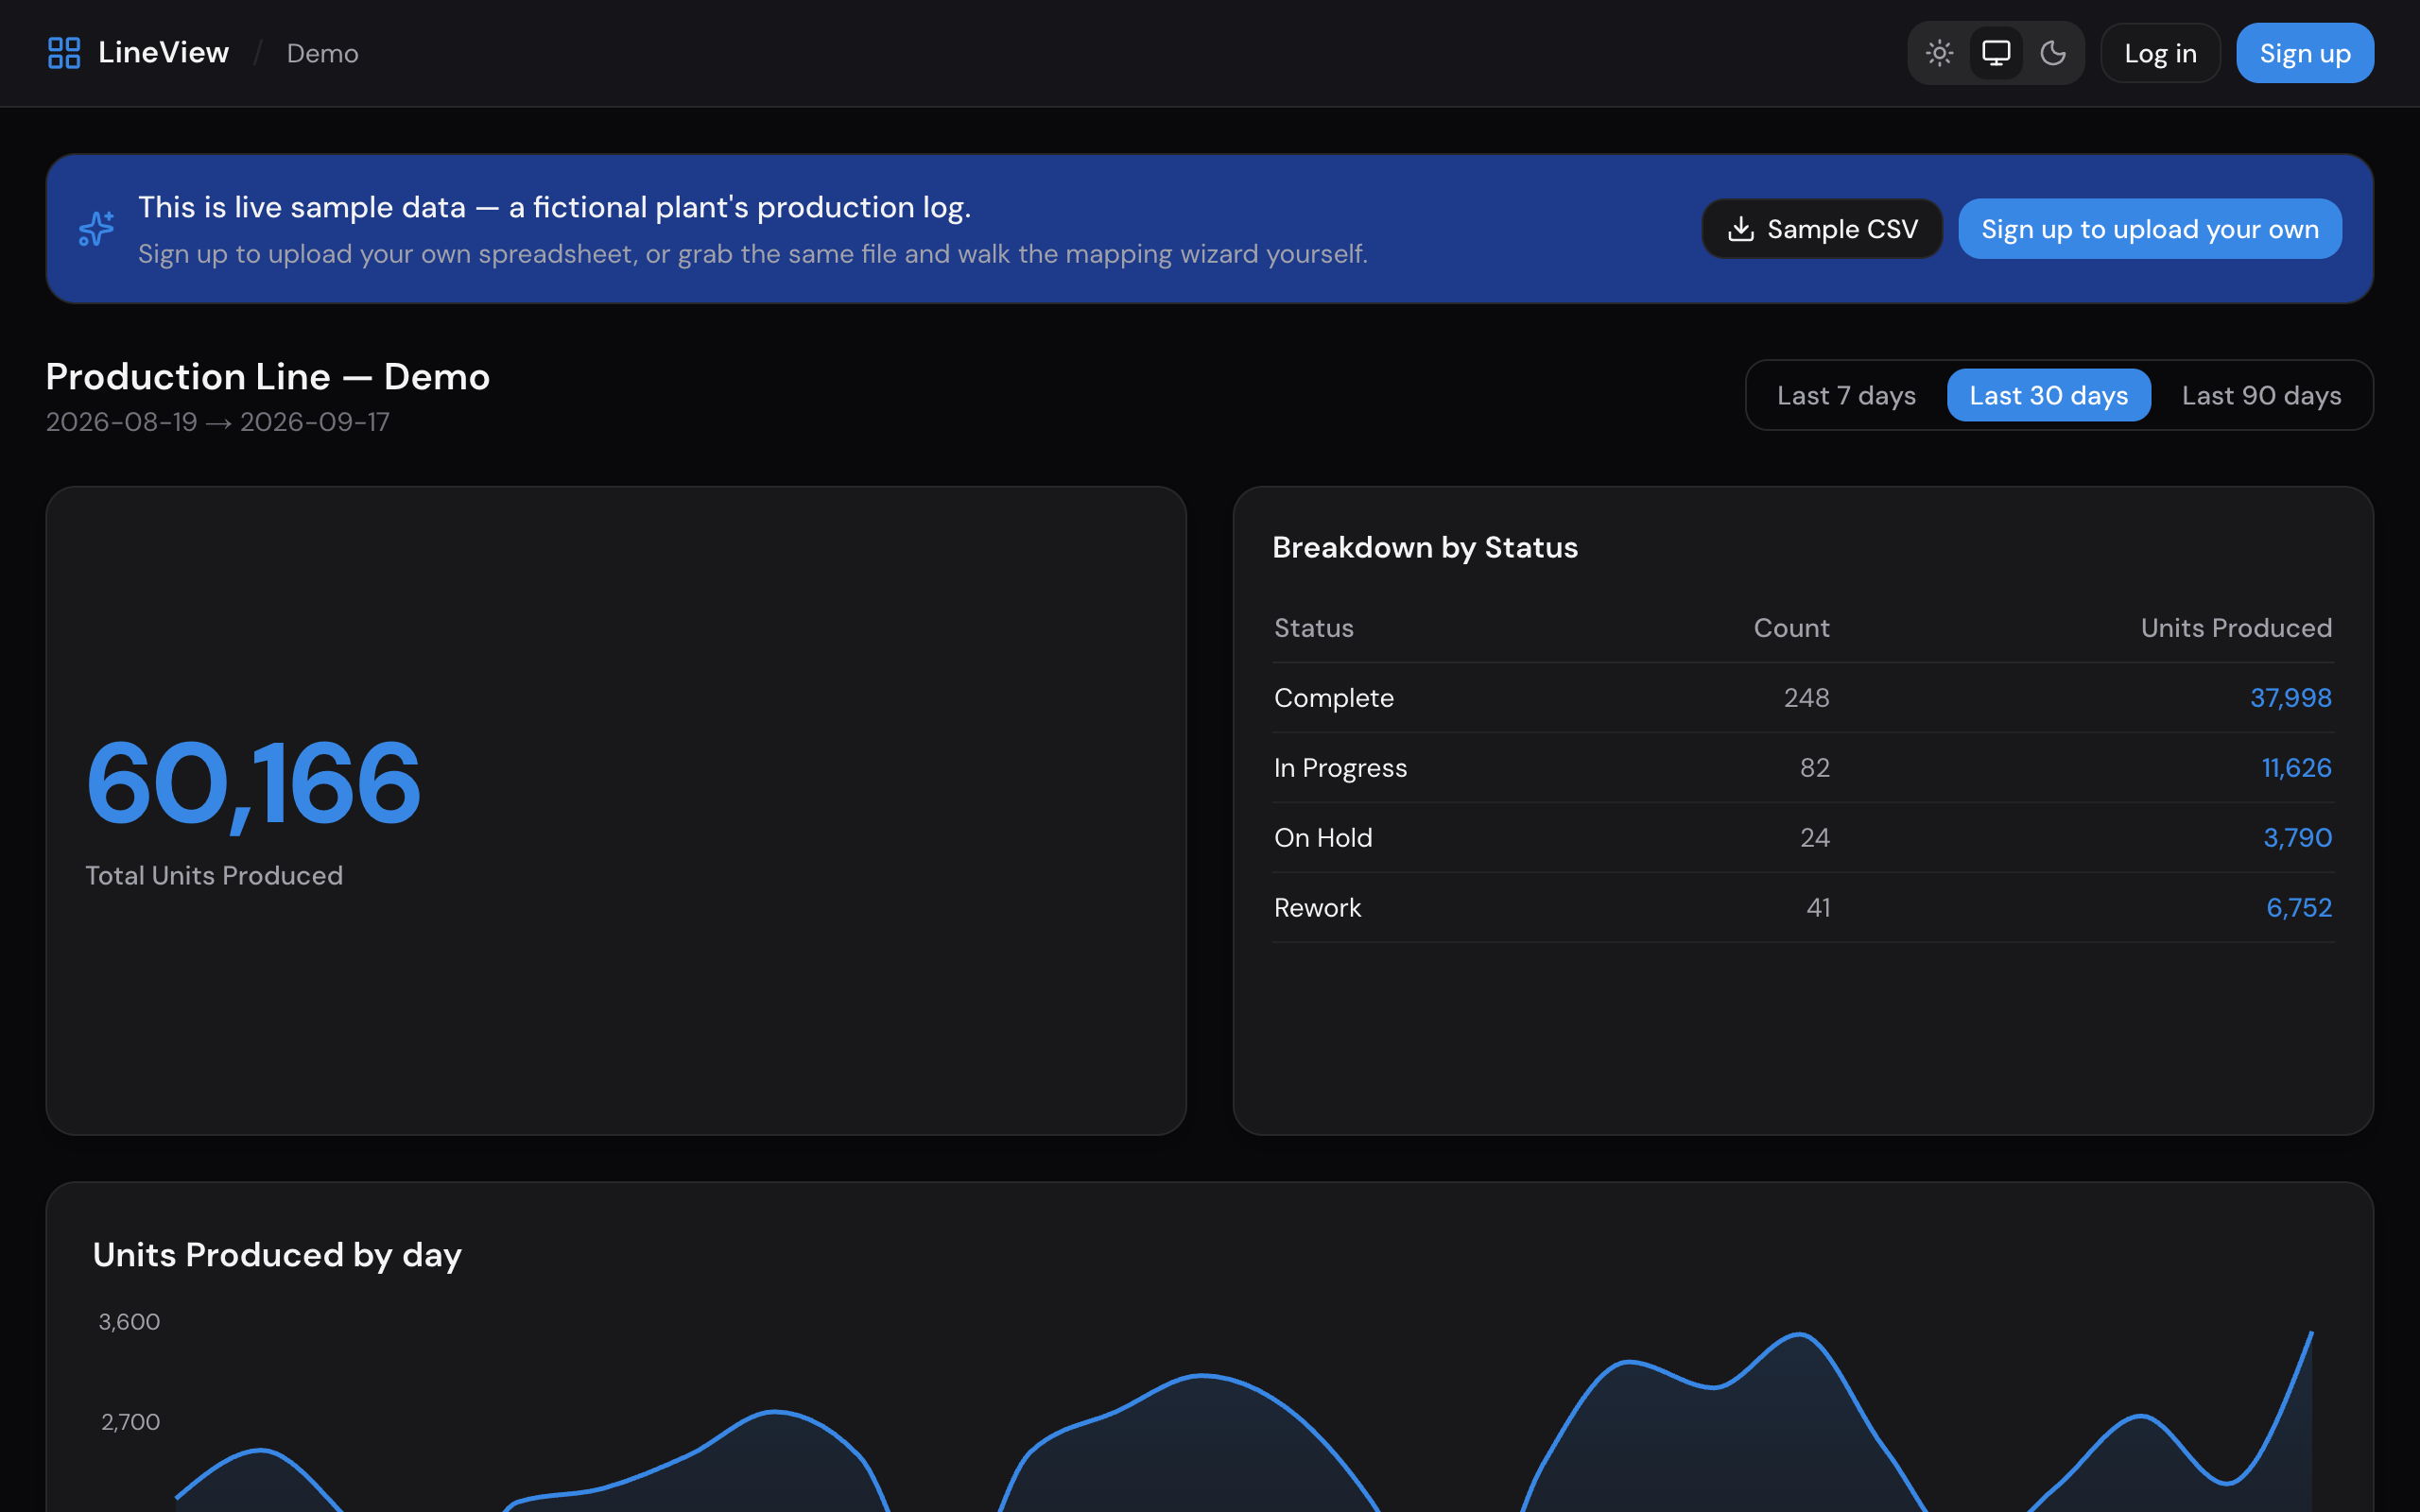
From spreadsheet to dashboard in three steps
The mapping is the whole setup. Do it once and every later upload of the same file shape is a re-import, not a project.
1.Upload
Drop in the .xlsx or .csv you already keep — up to 10 MB and 10,000 rows.
2.Map columns once
Say which column is the date, the number, the category. LineView guesses first, warns if a text column is about to become a chart of zeros, and lets you fold “complete”, “COMPLETE” and “Complete ” into one label.
3.Live dashboard
Totals, a daily trend, and breakdowns by any column in your file. Arrange the widgets, name them, and put it on a screen.
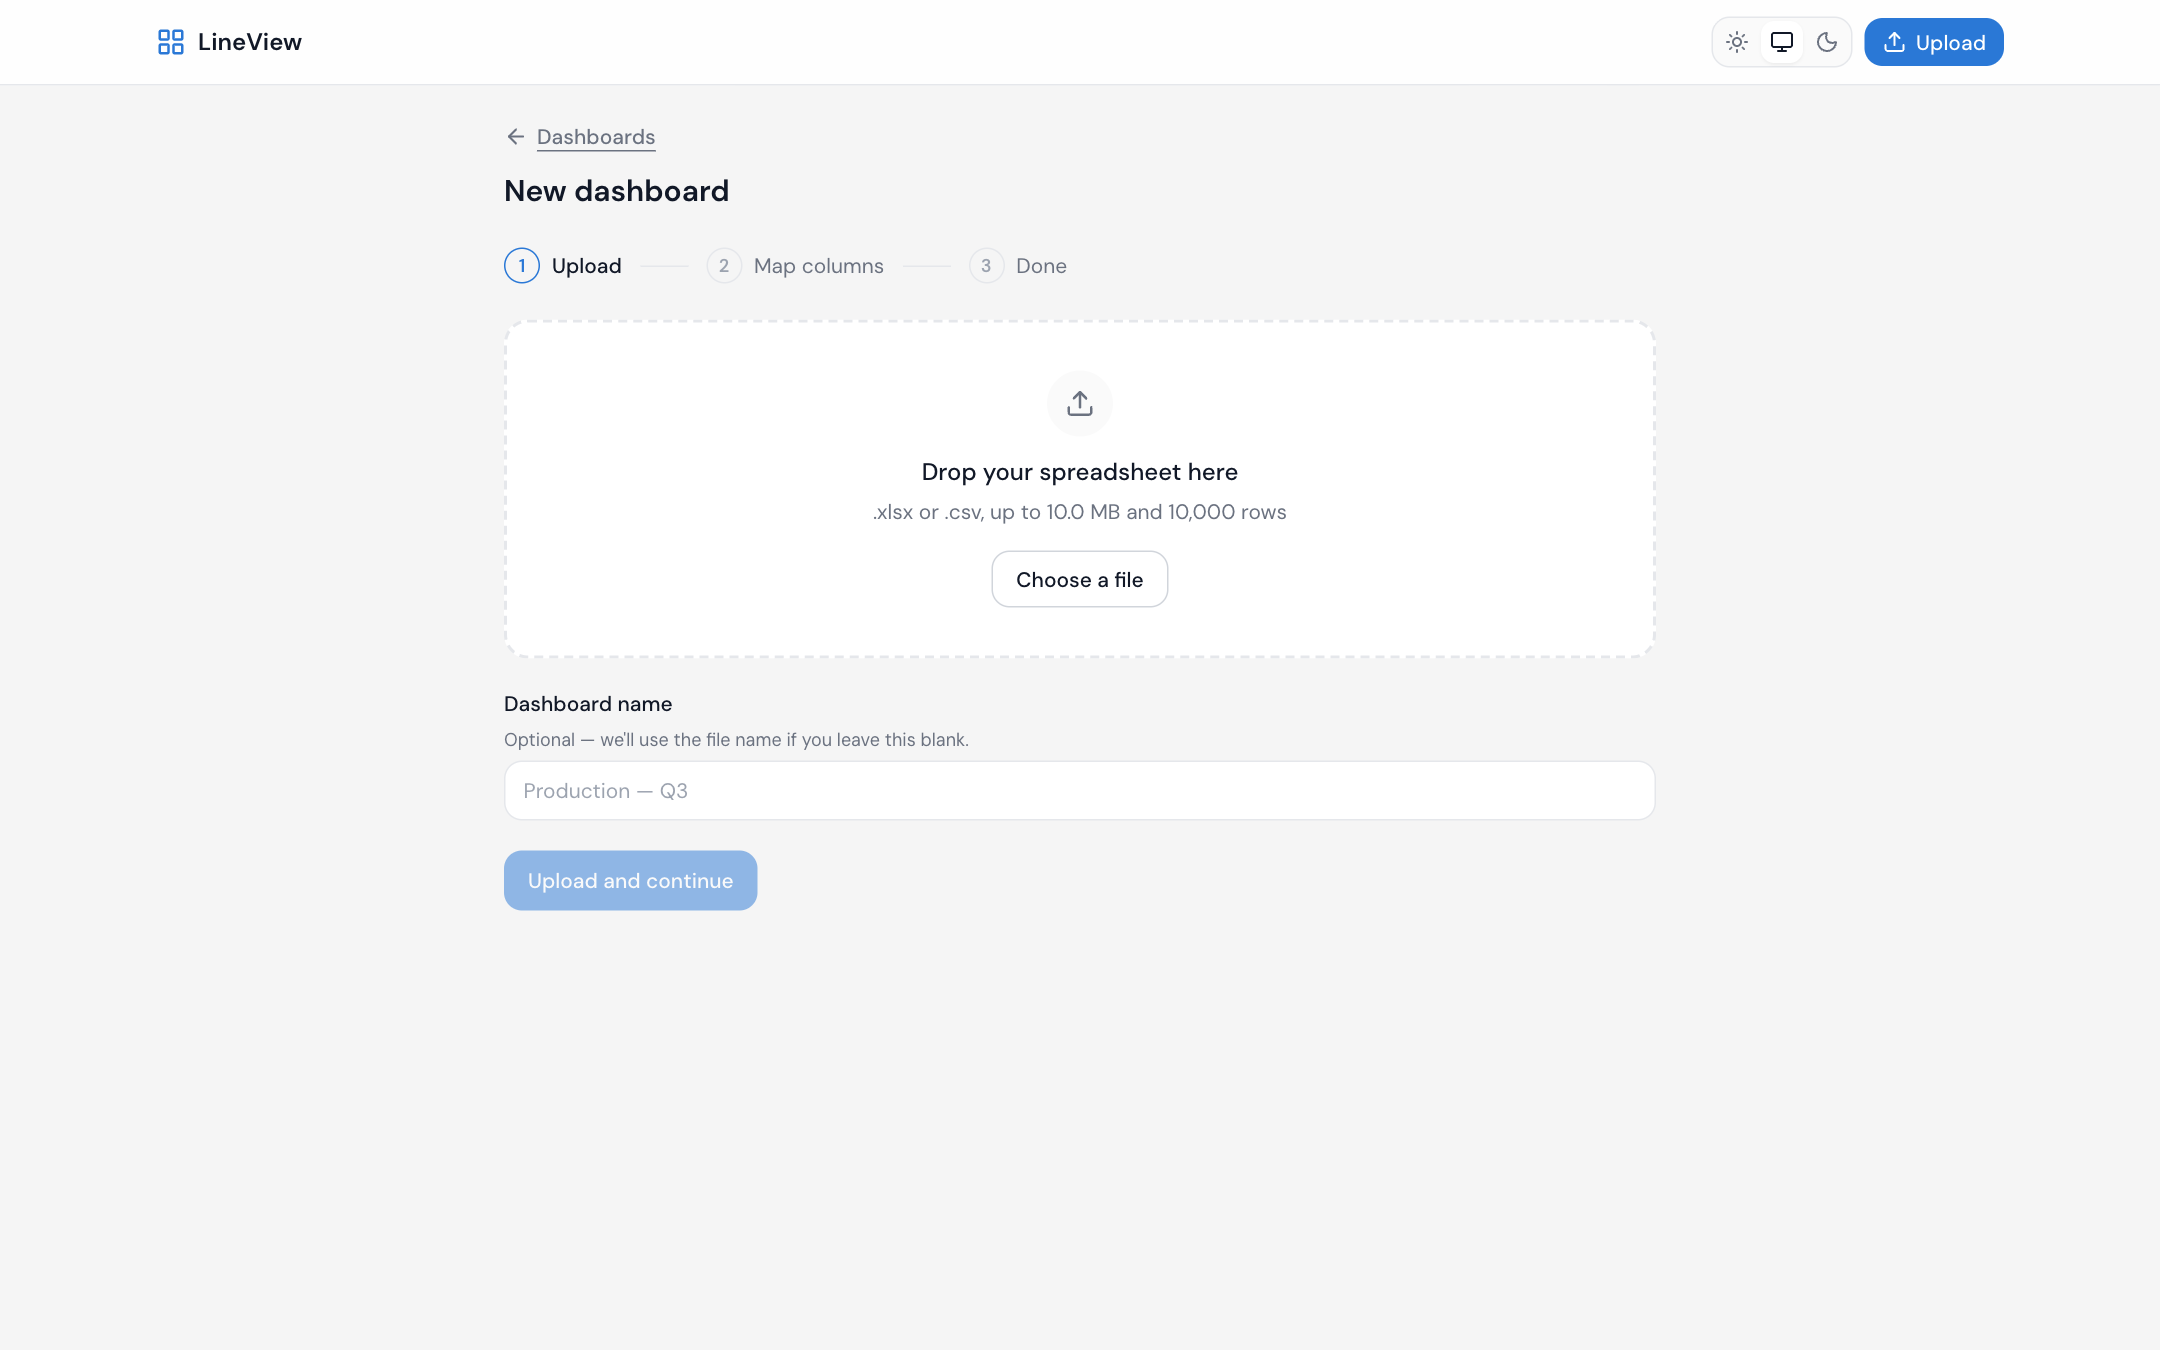
What's in the box
One-time mapping
Auto-detected fields, sample rows under every choice, and import checks that refuse a mapping that can't work.
Group by any column
Operator, shift, part number — any column in the spreadsheet becomes a chart or a breakdown table.
Drag-and-drop layout
Small, medium and large widgets on a four-column grid. Rename them; the layout is saved with the dashboard.
TV mode
A full-screen, auto-refreshing board sized for a wall display on the shop floor.
Light and dark
Follows your system or your choice. The wall display can run dark while the office runs light.
Your data stays yours
Multi-tenant on Postgres with row-level security. One organisation per account; nobody else's queries can reach your rows.
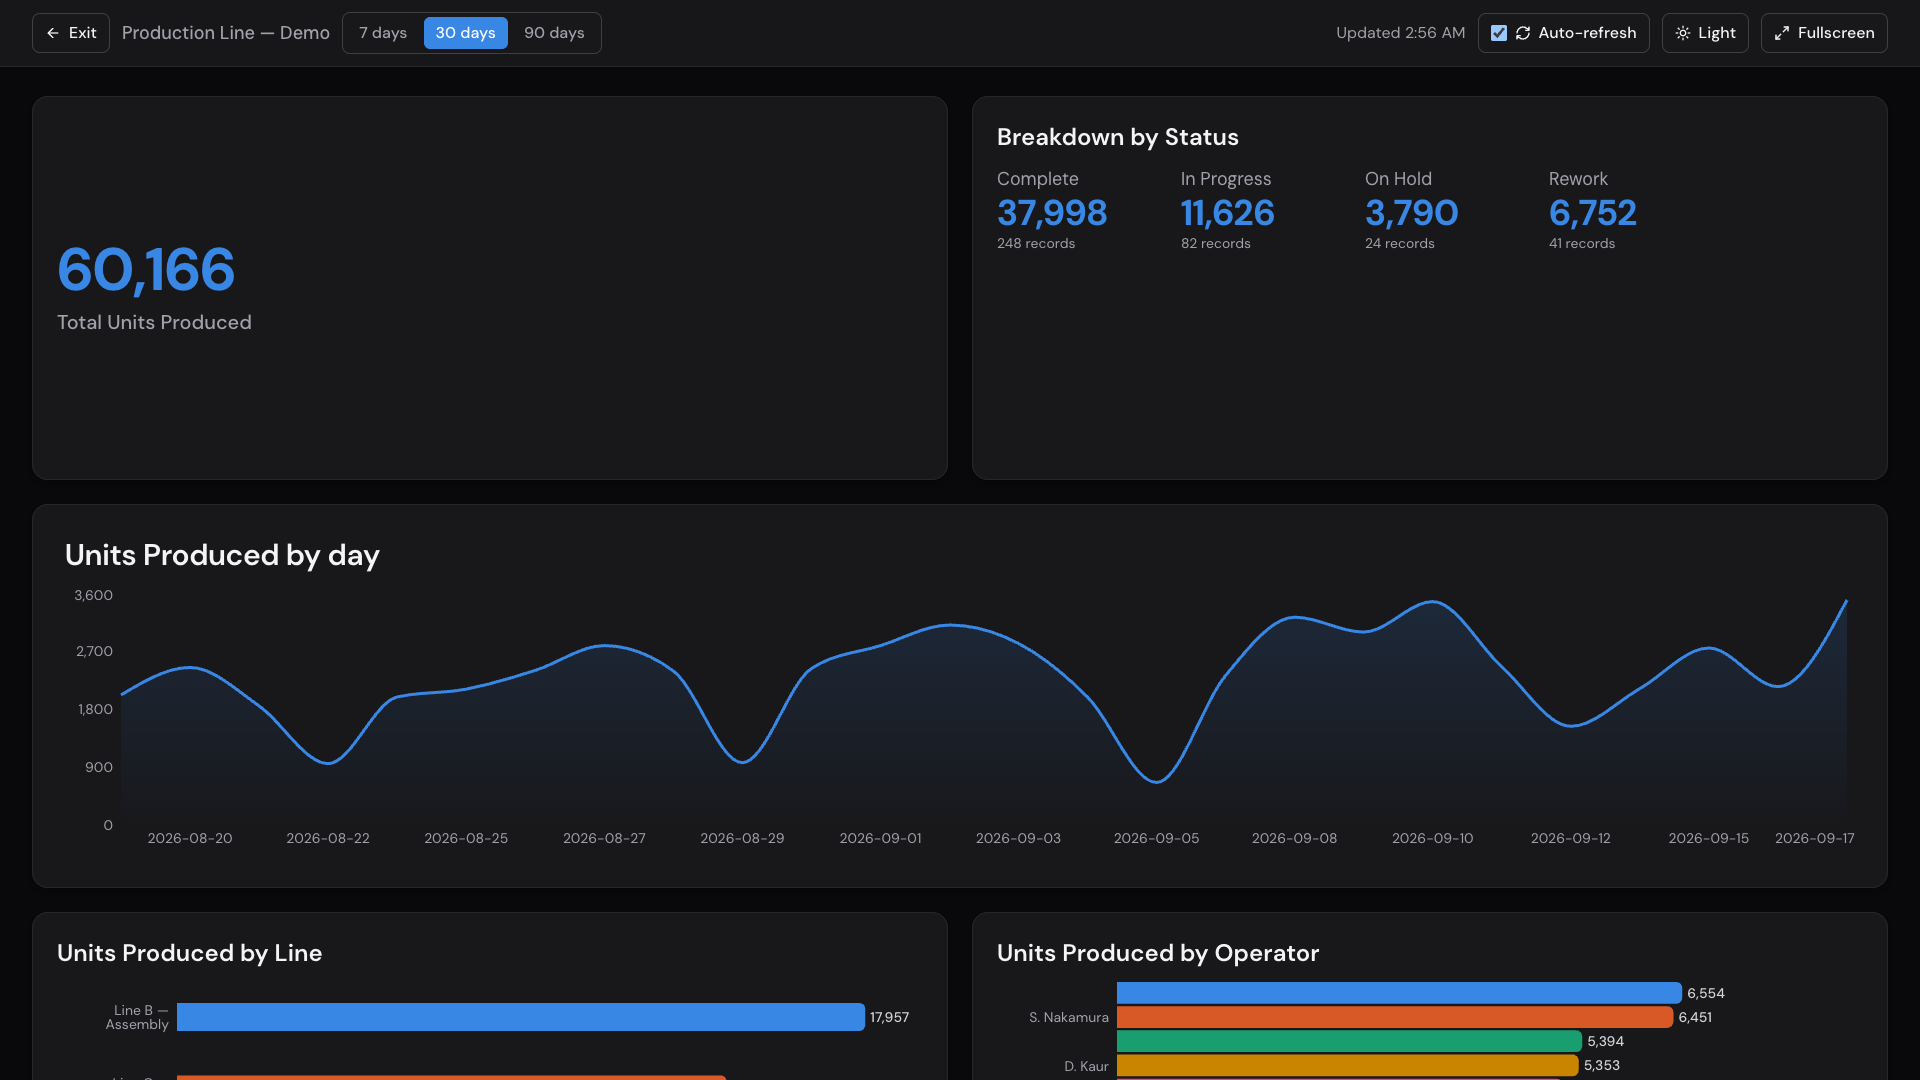
Put it on the wall
Any dashboard opens as a full-screen board sized for a display on the shop floor. It refreshes itself every minute and keeps the last good numbers up if a refresh fails.
- Fullscreen with one click; the controls tuck away when the mouse goes still
- 7, 30 and 90-day presets
- Its own light/dark switch, independent of the app's theme
See your own numbers this way
Grab the sample file from the demo and walk the wizard yourself, or upload a spreadsheet of your own.